

























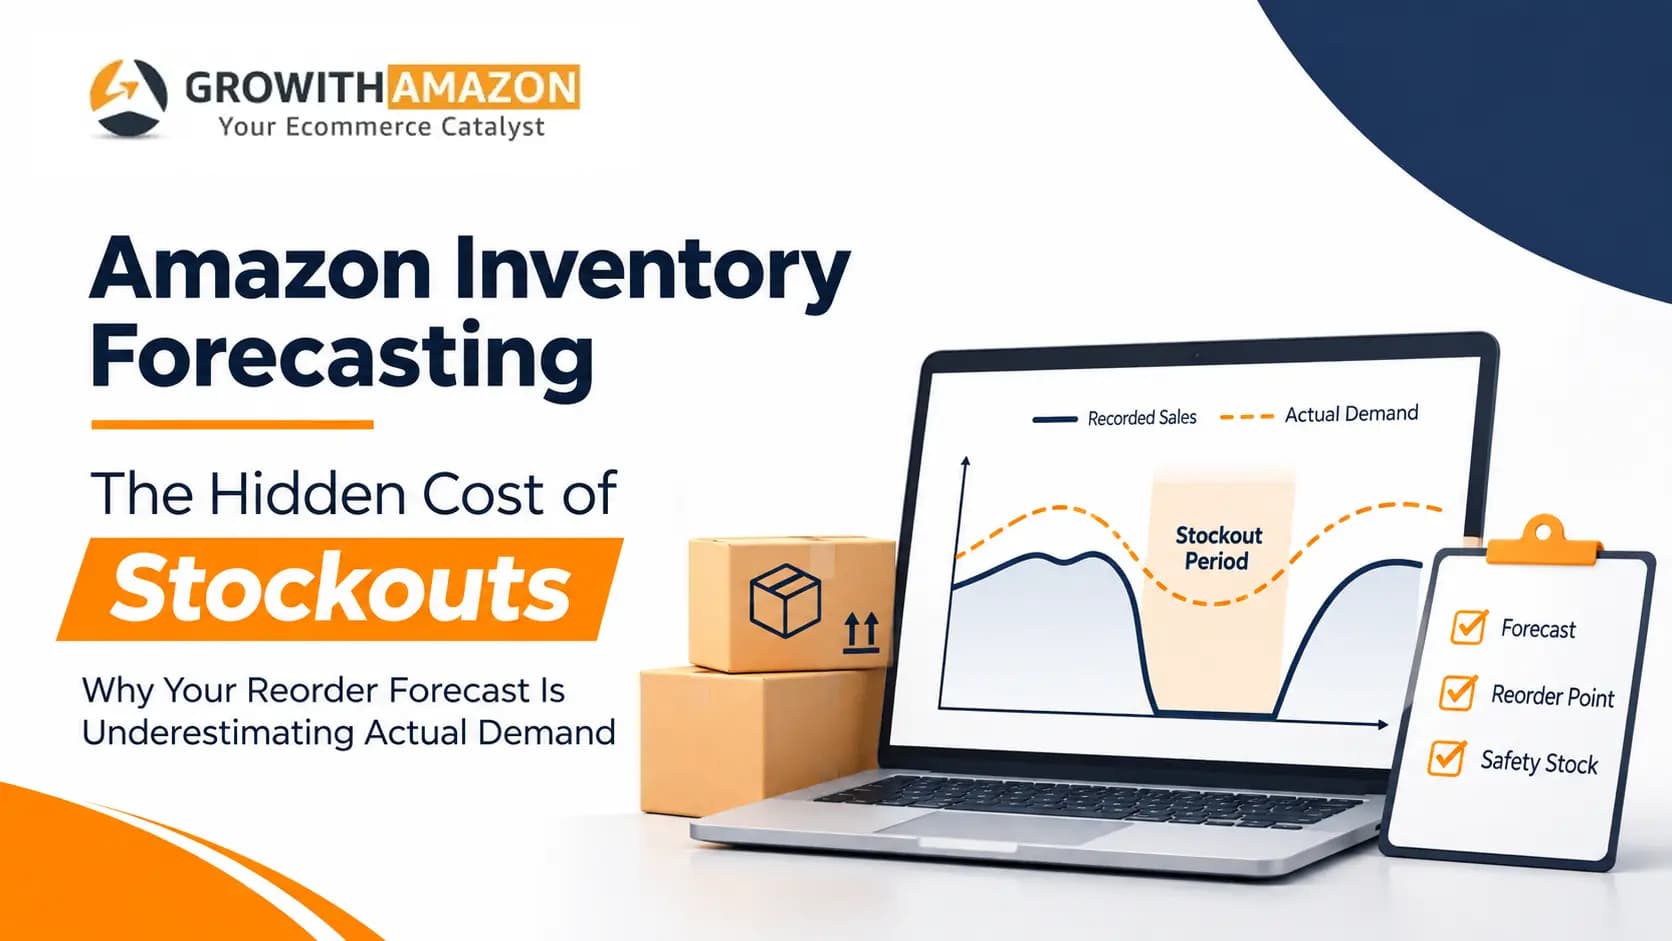
Stockout-Censored Demand: Why Your Amazon Reorder Forecast Is Underestimating Actual Demand
The problem is not always declining demand. Sometimes, it is the inventory shortage that prevents demand from appearing in your sales data. Stockout-censored demand is the part of customer demand that your sales report cannot show because there was no stock to sell. This guide explains how stockouts push reorder forecasts down, how to reconstruct the missing demand, and how to carry the corrected number into lead-time demand, safety stock and reorder points.
The problem is not always declining demand. Sometimes, it is the inventory shortage that prevents demand from appearing in your sales data.
Introduction: The Sales You Record Are Not Always the Sales You Could Have Made
A product generates consistent sales for several months. Its daily sales velocity is healthy, advertising is performing, and customer interest remains strong. Then a supplier delay creates a six-day stockout.
At the end of the month, the seller reviews the sales report. Revenue is lower, unit sales have declined, and the average daily sales figure suggests that demand is slowing.
Based on this information, the seller reduces the next purchase order.
But there is a fundamental problem with that decision: customers could not purchase the product during the six days when inventory was unavailable.
The seller has interpreted restricted sales as declining demand.
This is one of the most consequential weaknesses in conventional Amazon inventory forecasting. Historical sales data captures completed transactions, but it does not necessarily capture the full demand that existed while a product was unavailable.
For Amazon FBA and FBM sellers, this distinction can influence replenishment quantities, safety-stock requirements, purchasing decisions, cash-flow planning, and the ability to maintain product availability.
The underlying issue is known as stockout-censored demand. Understanding it requires a shift from forecasting what a product sold to estimating what customers would have purchased under normal inventory availability.
Table of Contents
- ●What Is Stockout-Censored Demand?
- ●Why Zero Sales During an Amazon Stockout Can Mislead Your Forecast
- ●The Stockout Feedback Loop: How One Inventory Shortage Creates Another
- ●Why Traditional Amazon Demand Forecasting Underestimates Demand
- ●How to Reconstruct Demand During Stockout Periods
- ●A Practical Amazon ASIN Case Study: Reconstructing Five Days of Hidden Demand
- ●Amazon Reorder Point Calculation: Moving From Forecast to Replenishment
- ●How to Use Amazon Seller Central Data to Identify Stockout Periods
- ●Special Forecasting Considerations for Growing Amazon Businesses
- ●A Strategic Framework for Improving Amazon Inventory Forecasting
- ●Common Amazon Inventory Forecasting Mistakes
- ●Purchase-Order Readiness: The Amazon Inventory Review Checklist
- ●Conclusion: Better Replenishment Starts With Better Demand Visibility
Need an Amazon expert on your side?
Work with specialists who manage PPC, SEO, catalog, and account health together — so every part of your Amazon business moves in the same direction.
Book a Call TodayWhat Is Stockout-Censored Demand?
Stockout-censored demand is the portion of underlying customer demand that cannot be fully observed because available inventory restricts the number of units that can be sold.
In simpler terms, sales reports show what customers successfully purchased, not necessarily everything they wanted to purchase.
Consider a product with potential customer demand of 20 units per day. If only 12 units are available, recorded sales cannot exceed those 12 units. The remaining eight units of potential demand are not reflected in completed sales.
This creates a gap between observed sales and unconstrained demand.
Observed Sales vs. Actual Demand: Understanding the Difference
| Concept | Meaning | Inventory implication |
|---|---|---|
| Observed sales | Units successfully purchased | What historical sales reports capture |
| Unconstrained demand | Purchases customers would make if supply were sufficient | The demand the forecast needs to estimate |
| Lost sales | Potential purchases not completed because stock was unavailable | Estimated commercial opportunity lost |
| Censored demand | Demand that cannot be fully observed because of the supply constraint | Requires reconstruction or statistical estimation |
A useful distinction is that censored demand describes an incomplete observation, whereas lost sales describe the potential transactions that were not fulfilled. The two concepts are related, but they are not interchangeable.
Need an Amazon expert on your side?
Work with specialists who manage PPC, SEO, catalog, and account health together — so every part of your Amazon business moves in the same direction.
Book a Call TodayWhy Zero Sales During an Amazon Stockout Can Mislead Your Forecast
A zero-sales day does not always mean customers have lost interest in a product. It can represent two very different commercial situations.
Situation A: Genuine zero demand. The product is available, its listing is purchasable, but no customers place an order.
Situation B: Supply-constrained zero sales. The product is unavailable, the offer cannot be purchased, and customers cannot complete an order.
Treating both situations as identical introduces a forecasting error.
A historical sales model that automatically assigns zero demand to every unavailable day assumes that customers had the opportunity to purchase but chose not to. That assumption is not valid.
The distinction becomes particularly important for products with:
- ●Consistent historical sales velocity.
- ●Strong seasonal demand.
- ●High advertising investment.
- ●Long supplier lead times.
- ●Limited production capacity.
- ●Significant marketplace competition.
Research by Adam J. Mersereau, published in *Manufacturing & Service Operations Management* in 2015, examines precisely this problem. The research explains that sales observations are censored when a retailer cannot sell more than its available inventory, and that failing to account for inventory uncertainty can systematically bias demand estimates downward.
This is not simply a reporting inconvenience. It is a statistical limitation that can influence purchasing decisions.
Need an Amazon expert on your side?
Work with specialists who manage PPC, SEO, catalog, and account health together — so every part of your Amazon business moves in the same direction.
Book a Call TodayThe Stockout Feedback Loop: How One Inventory Shortage Creates Another
The commercial consequences often extend beyond the original stockout.
A seller experiences an inventory shortage, observes lower historical sales, and uses those figures to prepare the next replenishment order.
The following sequence then develops:
- 1.Availability is restricted: The product becomes unavailable for several days.
- 2.Observed sales decline: Completed transactions fall because customers cannot purchase the product.
- 3.Demand is underestimated: The forecasting model treats restricted sales as weaker customer demand.
- 4.Replenishment is reduced: The next purchase order is smaller than the actual requirement.
- 5.Inventory coverage becomes insufficient: Existing stock cannot support demand throughout the next replenishment cycle.
- 6.Another stockout occurs: The same product becomes unavailable again.
This is a stockout-driven forecasting feedback loop. In short: inventory shortage → incomplete sales history → underestimated forecast → insufficient reorder quantity → repeated stockout.
Breaking this cycle requires sellers to correct the demand information before using it to calculate replenishment requirements.
Need an Amazon expert on your side?
Work with specialists who manage PPC, SEO, catalog, and account health together — so every part of your Amazon business moves in the same direction.
Book a Call TodayWhy Traditional Amazon Demand Forecasting Underestimates Demand
Many sellers begin with a straightforward calculation:
Average Daily Sales = Total Units Sold ÷ Number of Days
This is easy to calculate and useful when inventory is consistently available and demand is relatively stable. However, it becomes unreliable when the observation period includes stockouts.
The Limitation of Simple Moving Averages
Suppose an ASIN records 240 units sold over 30 calendar days.
The basic calculation gives: 240 ÷ 30 = 8 units per day.
However, assume the product was available for only 20 days. Its in-stock sales velocity was: 240 ÷ 20 = 12 units per day.
The difference is four units per day. The moving average has effectively treated ten unavailable days as days of zero customer demand. That can materially distort the forecast.
Beyond stockouts, five other limitations are worth watching.
Seasonality
Demand during peak shopping periods may be substantially different from normal trading periods.
Promotional Activity
Discounts and campaigns can increase conversion and sales velocity.
Traffic Fluctuations
Changes in sessions may indicate that customer interest is increasing or decreasing independently of inventory availability.
Listing Availability
A product can have physical stock but still be unavailable because of listing restrictions, stranded inventory, or offer-related problems.
Intermittent Demand
Products that sell irregularly need different forecasting techniques from consistently selling products. Croston's 1972 research introduced a method that separately estimates demand size and the interval between demand occurrences. This can be useful for slow-moving inventory, although it does not independently solve stockout censoring.
The central principle is that forecasting methods must reflect the conditions under which sales were observed.
Need an Amazon expert on your side?
Work with specialists who manage PPC, SEO, catalog, and account health together — so every part of your Amazon business moves in the same direction.
Book a Call TodayHow to Reconstruct Demand During Stockout Periods
Demand reconstruction estimates the sales that could reasonably have occurred if inventory had remained available.
There is no universal method that produces a perfectly accurate answer for every product. The strongest approach combines historical sales, availability information, traffic, conversion, promotional activity, and inventory records.
1. Establish a Comparable In-Stock Baseline
Start by identifying periods when the ASIN was consistently available. Use those periods to calculate a representative sales rate.
Estimated Daily Demand = Comparable In-Stock Units Sold ÷ Comparable In-Stock Days
For example: units sold 360, comparable in-stock days 30, so estimated daily demand = 360 ÷ 30 = 12 units. If the product subsequently experiences a five-day stockout, the initial lost-demand estimate becomes 12 × 5 = 60 units.
This approach assumes that demand conditions remained reasonably similar. If the stockout occurred during a major promotional event or seasonal peak, the baseline must be adjusted.
2. Account for Weekday and Seasonal Patterns
Demand is not always evenly distributed across a week. A product might sell more on Fridays, Saturdays, and Sundays than on weekdays. Using a flat daily average can therefore distort the estimate.
Instead, compare equivalent weekdays and, where appropriate, similar seasonal periods. For example, if a product historically sells 15 units on Saturdays but eight units on Tuesdays, a stockout covering both days should reflect those differences.
Seasonal comparisons should also account for changes in pricing, competition, advertising, and product maturity.
3. Use Sessions and Conversion Rates to Estimate Demand
Amazon Business Reports can provide useful traffic and conversion indicators. A simplified estimation formula is:
Estimated Units = Expected Sessions × Expected Unit Conversion Rate
Hypothetical example: expected daily sessions 400, expected unit conversion rate 3%, estimated daily demand 12 units. For five unavailable days: 400 × 3% × 5 = 60 estimated units.
This method can be useful when comparable traffic information is available. However, it is an estimate, not proof of lost purchases. Conversion may change because customers encounter competing products, different prices, delivery dates, or unavailable offers.
Also, use consistent definitions of sessions, orders, and units. A unit conversion rate should not be confused with an order conversion rate when customers can purchase multiple units in one order.
4. Adjust for Advertising and Promotional Demand
Promotional periods require separate treatment. If an ASIN normally sells ten units daily but reaches 25 units during a discount campaign, applying its regular velocity to a promotional stockout will underestimate demand.
Review:
- ●Promotional dates and discount depth.
- ●Sponsored Products and Sponsored Brands activity.
- ●Daily advertising spend and attributed sales.
- ●Organic traffic and conversion.
- ●Competitive pricing and availability.
- ●Previous comparable promotional periods.
Where historical promotional comparisons are unavailable, build a scenario range instead of presenting one uncertain number as fact.
5. Reconcile Inventory Availability
Before estimating lost demand, establish whether the product was actually purchasable.
For FBA, examine available, reserved, inbound, stranded, damaged, and other inventory dispositions. For FBM, reconcile physical warehouse stock, customer commitments, cancellations, and listing availability.
A product with units in an Amazon fulfilment centre is not necessarily immediately available for sale. Likewise, a zero-sales period could result from listing suppression rather than a physical stockout. These events should be classified separately because they have different operational causes and corrective actions.
Need an Amazon expert on your side?
Work with specialists who manage PPC, SEO, catalog, and account health together — so every part of your Amazon business moves in the same direction.
Book a Call TodayA Practical Amazon ASIN Case Study: Reconstructing Five Days of Hidden Demand
The following case study is entirely hypothetical. It uses illustrative figures to demonstrate how stockout-censored demand affects forecasting and replenishment decisions. It is not actual Amazon platform data or a GrowWithAmazon client result.
Product Scenario
A private-label kitchen accessory has relatively stable demand.
| Metric | Hypothetical value |
|---|---|
| Forecast observation period | 30 days |
| Normal daily demand | 12 units |
| In-stock days | 25 |
| Stockout duration | 5 days |
| Recorded sales | 300 units |
The product sold 12 units on each of its 25 available days. Recorded sales: 25 × 12 = 300 units.
Step 1: Calculate the Unadjusted Sales Velocity
300 ÷ 30 = 10 units per day. This is the conventional calendar-day average.
Step 2: Estimate Demand During the Stockout
Using comparable in-stock periods: 300 ÷ 25 = 12 units per day. Estimated lost demand: 12 × 5 = 60 units.
Step 3: Calculate Reconstructed Demand
| Demand component | Units |
|---|---|
| Recorded sales | 300 |
| Estimated lost demand | 60 |
| Reconstructed demand | 360 |
| Unadjusted daily average | 10 |
| Adjusted daily demand | 12 |
The adjusted estimate is 20% higher than the unadjusted daily average. The 60 additional units are estimated potential demand, not actual fulfilled sales.
Step 4: Understand the Purchasing Impact
Assume the following replenishment conditions:
| Planning variable | Assumption |
|---|---|
| Supplier and inbound lead time | 28 days |
| Adjusted average daily demand | 12 units |
| Daily demand standard deviation | 3 units |
| Service-level factor | 1.65 |
| Current inventory position | 300 units |
For this example, assume daily demand is independent and lead time is fixed.
Lead-time demand: 12 × 28 = 336 units.
Safety stock: 1.65 × 3 × √28 = approximately 26 units.
Reorder point: 336 + 26 = 362 units.
The recommended reorder trigger under these assumptions is approximately 362 units of inventory position. Now compare this with the unadjusted forecast.
| Metric | Unadjusted forecast | Adjusted forecast |
|---|---|---|
| Daily demand | 10 | 12 |
| Lead-time demand | 280 | 336 |
| Safety stock | 26 | 26 |
| Reorder point | 306 | 362 |
The difference is 56 units. The seller using the unadjusted forecast would trigger replenishment 56 units later than the adjusted model.
With an inventory position of 300 units, the unadjusted model would not yet trigger an order, while the adjusted model would indicate that replenishment is already required. This is the commercial consequence of using incomplete sales history.
Important assumption: The example holds daily demand variability constant between the two forecasts to isolate the effect of correcting average demand. In a real inventory model, variability must also be recalculated using appropriate in-stock observations and uncertainty estimates.
Need an Amazon expert on your side?
Work with specialists who manage PPC, SEO, catalog, and account health together — so every part of your Amazon business moves in the same direction.
Book a Call TodayAmazon Reorder Point Calculation: Moving From Forecast to Replenishment
An accurate demand estimate is only one part of inventory planning. Sellers must also account for supplier lead times, inbound transportation, fulfilment-centre receiving, demand variability, and the amount of protection required against unexpected changes.
What Is a Reorder Point?
A reorder point is the inventory position at which a seller should initiate replenishment to cover expected demand during the replenishment lead time, including an appropriate safety-stock buffer.
Reorder Point = Lead-Time Demand + Safety Stock
Where Lead-Time Demand = Average Daily Demand × Lead Time in Days. For example, with daily demand of 20 units, a replenishment lead time of 30 days and safety stock of 100 units: lead-time demand = 20 × 30 = 600 units, and the reorder point = 600 + 100 = 700 units. When inventory position reaches 700 units, the seller should initiate replenishment.
How to Calculate Safety Stock
For relatively stable demand and fixed lead times, a common statistical formula is:
Safety Stock = Z × σd × √L
Where Z is the service-level factor, σd is the standard deviation of daily demand, and L is the replenishment lead time in days.
A Z-value of approximately 1.65 is associated with a 95% cycle service level under the normal-distribution assumptions of this model. This does not guarantee a 95% in-stock rate or a 95% fill rate.
When both demand and lead time vary independently, a more appropriate model is:
Safety Stock = Z × √(L × σd² + d² × σL²)
Where d is average daily demand, σL is the standard deviation of lead time, and L is the average lead time. This formula accounts for both demand variability and supplier lead-time variability, assuming the stated independence and distribution conditions.
For highly seasonal, intermittent, or rapidly changing products, more advanced simulation or service-level models may be appropriate.
Why Supplier Lead Time Needs Careful Measurement
A common mistake is to measure lead time only from purchase-order confirmation to supplier dispatch. The actual replenishment cycle may include:
- 1.Purchase-order approval.
- 2.Manufacturing or supplier processing.
- 3.Quality inspection and packing.
- 4.International transportation.
- 5.Customs clearance.
- 6.Delivery appointment or fulfilment-centre transit.
- 7.Amazon receiving and inventory availability.
For FBA, stock that has been shipped is not necessarily immediately sellable. For FBM, the equivalent calculation should reflect the time required to receive stock into the seller's warehouse and make it available for fulfilment.
Lead-time assumptions should therefore be based on actual historical replenishment performance, not only supplier promises.
Need an Amazon expert on your side?
Work with specialists who manage PPC, SEO, catalog, and account health together — so every part of your Amazon business moves in the same direction.
Book a Call TodayHow to Use Amazon Seller Central Data to Identify Stockout Periods
Reliable Amazon inventory planning requires combining sales and inventory information. No single report should be assumed to provide a complete record of customer demand and historical product availability. The following Seller Central resources can support the analysis.
1. Inventory Ledger Report
The Inventory Ledger Report provides historical FBA inventory movements, including opening and closing balances, receipts, customer orders, returns, removals, damages, and adjustments. It is particularly useful for reconciling how inventory changed over time.
Official resource: Inventory Ledger Report help page
2. Business Reports: Sales and Traffic
The By Date: Sales and Traffic report can help sellers analyse ordered product sales, units ordered, sessions, page views, unit session percentage and Featured Offer percentage. These metrics help distinguish a traffic problem from a conversion problem.
Official resource: Sales and Traffic Business Report help page
3. FBA Inventory Overview
Amazon's FBA Inventory overview supports monitoring inventory health, future demand planning, excess inventory, and stranded inventory.
Official resource: FBA Inventory overview help page
4. Amazon Fulfilment Reports
Amazon Fulfilment Reports can help sellers monitor shipments, make replenishment decisions, and reconcile FBA inventory balances.
Official resource: Fulfilment Reports help page
5. Maintain Your Own Historical Availability Record
Seller Central reports provide important information, but sellers should maintain their own daily ASIN/SKU availability history. A useful tracking structure includes:
| Field | Why it matters |
|---|---|
| Date | Establishes the observation period |
| ASIN and SKU | Identifies the product |
| Opening sellable stock | Establishes starting availability |
| Units ordered and shipped | Tracks transaction activity |
| Closing inventory | Supports reconciliation |
| Reserved inventory | Identifies units not immediately available |
| Inbound units | Tracks future supply |
| Listing status | Identifies offer restrictions |
| Sessions | Measures customer traffic |
| Unit session percentage | Supports conversion analysis |
| Promotional activity | Identifies unusual demand conditions |
| Estimated lost demand | Records the reconstructed estimate |
The important distinction is that inventory movements alone do not prove that a listing was continuously purchasable. Reconcile inventory records with offer availability, listing status, and any known restrictions.
For FBM sellers, internal warehouse inventory records are essential because FBA inventory reports do not represent the seller's own warehouse stock.
Need an Amazon expert on your side?
Work with specialists who manage PPC, SEO, catalog, and account health together — so every part of your Amazon business moves in the same direction.
Book a Call TodaySpecial Forecasting Considerations for Growing Amazon Businesses
A forecasting method that works for a stable, high-volume ASIN may fail when applied to a new product, a seasonal product, or an intermittent seller.
Promotional Periods and Major Shopping Events
Prime Day, Black Friday, Cyber Monday, and category-specific promotions can change sales velocity significantly. Forecast these periods separately using comparable promotional history, expected advertising investment, discounts, and current inventory availability. Avoid using normal daily sales averages to estimate promotional stockout demand.
New ASINs and Product Launches
New ASINs have limited historical information. Sellers should use comparable products, launch forecasts, keyword demand, traffic assumptions, advertising plans, and early conversion data. Forecasts should be updated frequently as actual sales information becomes available.
Multiple Amazon Marketplaces
A product sold in the USA, UK, UAE, and KSA should not automatically use one global demand average. Each marketplace has different demand patterns, currencies, seasonality, competition, delivery expectations, and replenishment lead times. Forecast each marketplace separately before consolidating manufacturing or procurement requirements.
Intermittent-Demand Products
Some products may sell only a few units each month. Several zero-sales days may be entirely normal when inventory is available. These products require a distinction between genuine intermittent demand and supply-constrained observations.
Methods such as Croston's approach may help estimate irregular demand, but stockout periods must still be identified separately.
FBA and FBM Inventory Should Not Be Treated Identically
FBA inventory depends on fulfilment-centre availability and inbound processing. FBM inventory depends on physical warehouse stock, order commitments, fulfilment capacity, and seller-controlled dispatch.
A combined ASIN forecast may be useful for total customer demand, but operational replenishment calculations should retain the separate supply positions and lead times.
Need an Amazon expert on your side?
Work with specialists who manage PPC, SEO, catalog, and account health together — so every part of your Amazon business moves in the same direction.
Book a Call TodayA Strategic Framework for Improving Amazon Inventory Forecasting
A reliable forecasting process should not depend on one spreadsheet formula or a single monthly sales report. It should combine demand estimation, inventory reconciliation, supplier planning, and regular performance reviews.
Step 1: Establish a Clean Historical Demand Baseline
Separate genuinely in-stock days from unavailable days. Exclude abnormal periods from the baseline or model them separately.
Step 2: Build an Availability Timeline
Use inventory records, listing status, fulfilment information, and warehouse records to identify stockout dates.
Step 3: Reconstruct Censored Demand
Use comparable in-stock sales, weekday patterns, traffic, conversion rates, promotional history, and seasonal behaviour.
Step 4: Build a Demand Forecast by ASIN and Marketplace
Apply the appropriate forecasting method to each product's demand pattern. Maintain separate scenarios where uncertainty is high.
Step 5: Calculate Lead-Time Demand
Include manufacturing, transit, customs, receiving, and any other relevant replenishment delays.
Step 6: Set Safety Stock and Reorder Points
Consider demand variability, supplier reliability, inventory position, and the desired service level.
Step 7: Review Forecast Accuracy Continuously
Compare actual in-stock demand with forecast demand. Monitor stockout frequency, excess inventory, supplier delays, and forecast bias.
A weekly review is generally appropriate for fast-moving or high-risk products. Slower-moving products can follow a less frequent review schedule, provided their lead times and business risks are considered.
Need an Amazon expert on your side?
Work with specialists who manage PPC, SEO, catalog, and account health together — so every part of your Amazon business moves in the same direction.
Book a Call TodayCommon Amazon Inventory Forecasting Mistakes
| Forecasting mistake | Better inventory practice |
|---|---|
| Treating stockout days as zero demand | Classify unavailable days separately |
| Using calendar-day averages without checking availability | Calculate comparable in-stock sales velocity |
| Ignoring promotional activity | Forecast promotional demand separately |
| Assuming all inbound stock is immediately sellable | Verify inventory status and receiving |
| Using one lead time for every supplier | Track actual supplier-level lead times |
| Applying identical safety stock to all ASINs | Model product-level demand variability |
| Combining multiple marketplaces into one forecast | Forecast by marketplace before consolidation |
| Treating every zero-sales day as a stockout | Distinguish genuine low demand from unavailability |
| Ignoring listing restrictions | Reconcile offer and listing availability |
| Reordering only when stock becomes critically low | Use inventory position and reorder-point triggers |
Purchase-Order Readiness: The Amazon Inventory Review Checklist
Before approving the next purchase order, sellers should confirm that the forecast reflects the product's actual selling conditions.
Demand Validation
☐ Have unavailable periods been identified? ☐ Has in-stock sales velocity been calculated? ☐ Has potential lost demand been estimated? ☐ Have weekday and seasonal patterns been reviewed? ☐ Have promotions and advertising changes been considered?
Inventory Validation
☐ Have FBA and FBM inventories been reconciled separately? ☐ Have reserved, damaged, stranded, and inbound units been checked? ☐ Has actual listing availability been reviewed? ☐ Have open purchase orders and shipment dates been considered?
Replenishment Validation
☐ Has supplier lead time been measured realistically? ☐ Has safety stock been recalculated? ☐ Has the reorder point been updated? ☐ Have marketplace-level requirements been consolidated? ☐ Have storage capacity, working capital, and supplier MOQs been considered?
Final Approval
☐ Does the purchase quantity reflect the latest demand forecast? ☐ Has the replenishment decision been documented? ☐ Is there a clear owner for the next inventory review?
Need an Amazon expert on your side?
Work with specialists who manage PPC, SEO, catalog, and account health together — so every part of your Amazon business moves in the same direction.
Book a Call TodayConclusion: Better Replenishment Starts With Better Demand Visibility
Amazon inventory forecasting is only as reliable as the information used to build it.
When products become unavailable, historical sales can understate customer demand. If those stockout periods are treated as normal zero-sales observations, sellers risk reducing forecasts precisely when they should be strengthening their replenishment plans.
The solution is not simply to increase purchase quantities or maintain excessive safety stock. It is to understand the difference between observed sales and underlying demand, reconstruct missing demand where evidence supports it, and incorporate that information into lead-time demand, safety stock, and reorder-point calculations.
For growing Amazon businesses, this requires a structured approach that connects sales performance, inventory availability, supplier reliability, and marketplace operations.
GrowithAmazon provides Amazon marketplace support across inventory management, FBA operations, Seller Central management, and broader marketplace growth.
If your business is experiencing repeated stockouts, inconsistent sales velocity, inaccurate replenishment forecasts, or excess inventory alongside shortages, the first step is to understand what your historical data is actually telling you.
Ready to Build Your Next Amazon Success Story?
If you're facing low sales, rising ACOS, inventory challenges, or declining performance, our Amazon agency can help. Book a free strategy consultation and discover the opportunities that can transform your business.
Explore the latest Amazon insights, content, and optimization guides trending with sellers in 2026.
Written by Rahul Bisht
Related Articles
Amazon Strategy
Single Unit, Multipack or Bundle? Prevent Amazon Product Identifier Mismatches With a Packaging Master
Noon Marketplace
Noon Statement of Account Reconciliation: Bridge Your Opening Balance to the Bank Payout
Amazon SEO